How Does the Stock Market Actually Work?
How the stock market works, stripped of jargon: what a share actually represents, why prices move constantly, and what really happens the moment you place a trade.
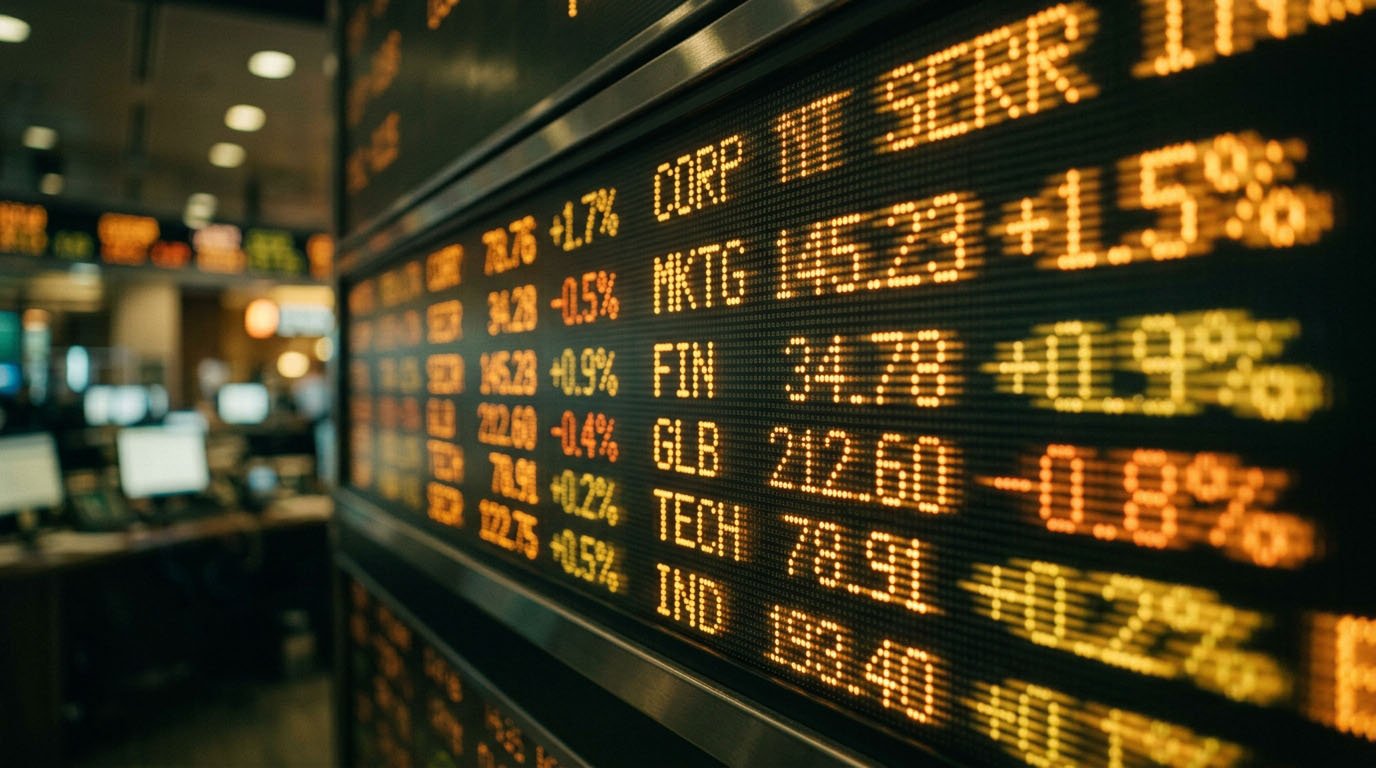
What a share of stock actually is
A share of stock represents a small piece of ownership in a company. Buy one share, and you own a tiny fraction of that business. That fraction covers its assets, its future profits, and, in most cases, a small vote in major company decisions. Companies sell shares to the public to raise money, typically to fund growth, pay down debt, or fund new projects, without taking on a traditional loan.
Most companies never issue new shares again after their initial public offering (IPO), the event where a private company first sells shares to the public. From that point forward, existing shareholders trade those same shares back and forth among each other on an exchange. The company itself doesn’t receive money from most day-to-day trading, only from that original sale.
Exchanges: where the actual trading happens
A stock exchange is a marketplace that connects buyers and sellers. The New York Stock Exchange (NYSE) and the Nasdaq are the two largest exchanges in the United States. Modern exchanges run almost entirely on computerized systems now. Buy and sell orders arrive electronically and match automatically in a fraction of a second. No human floor trader physically shouts orders the way older films often depict.
What actually happens when you place an order
When you place a buy order through a brokerage app, that order travels to an exchange. There, a matching engine pairs it against a corresponding sell order at an agreeable price. The whole process typically completes in well under a second.
Why prices move constantly
A stock’s price reflects what buyers currently believe the company is worth, weighed against what sellers currently believe it’s worth. More buyers than sellers at the current price pushes the price up, attracting more sellers. More sellers than buyers pushes the price down, attracting more buyers. This constant back-and-forth is called price discovery, and it never fully stops during trading hours.
Countless factors influence that buyer-and-seller balance. A company’s quarterly earnings report can move it. So can broader economic data like inflation or employment numbers, interest rate decisions from the Federal Reserve, industry news, or a shift in overall investor sentiment. Sometimes a stock’s price shifts within seconds of new information becoming public.
Market capitalization: sizing up a company
Market capitalization, or “market cap,” measures a company’s total value as the stock market currently prices it. Calculate it by multiplying the current share price by the total number of outstanding shares. A company with 1 billion shares trading at $50 each carries a $50 billion market cap.
Market cap lets investors compare company size on equal footing, regardless of share price alone. A $500 stock and a $5 stock can represent companies of similar total size, depending entirely on how many shares each company has issued. Share price by itself says very little about whether a company counts as large or small.
Indexes: tracking the market as a whole
A stock market index tracks the combined performance of a specific group of stocks, giving a single number that represents how that group moved overall. The S&P 500 tracks roughly 500 of the largest U.S. companies and serves as one of the most commonly cited benchmarks for the overall U.S. stock market. The Dow Jones Industrial Average tracks 30 large, well-established companies. The Nasdaq Composite tracks every company listed on the Nasdaq exchange, which skews heavily toward technology companies.
You can’t directly invest in an index itself, it’s just a number, a calculation. Index funds and ETFs exist to solve that. They let investors buy a single fund holding all, or nearly all, of the companies within a given index, approximating that index’s performance in one purchase.
How you actually make (or lose) money
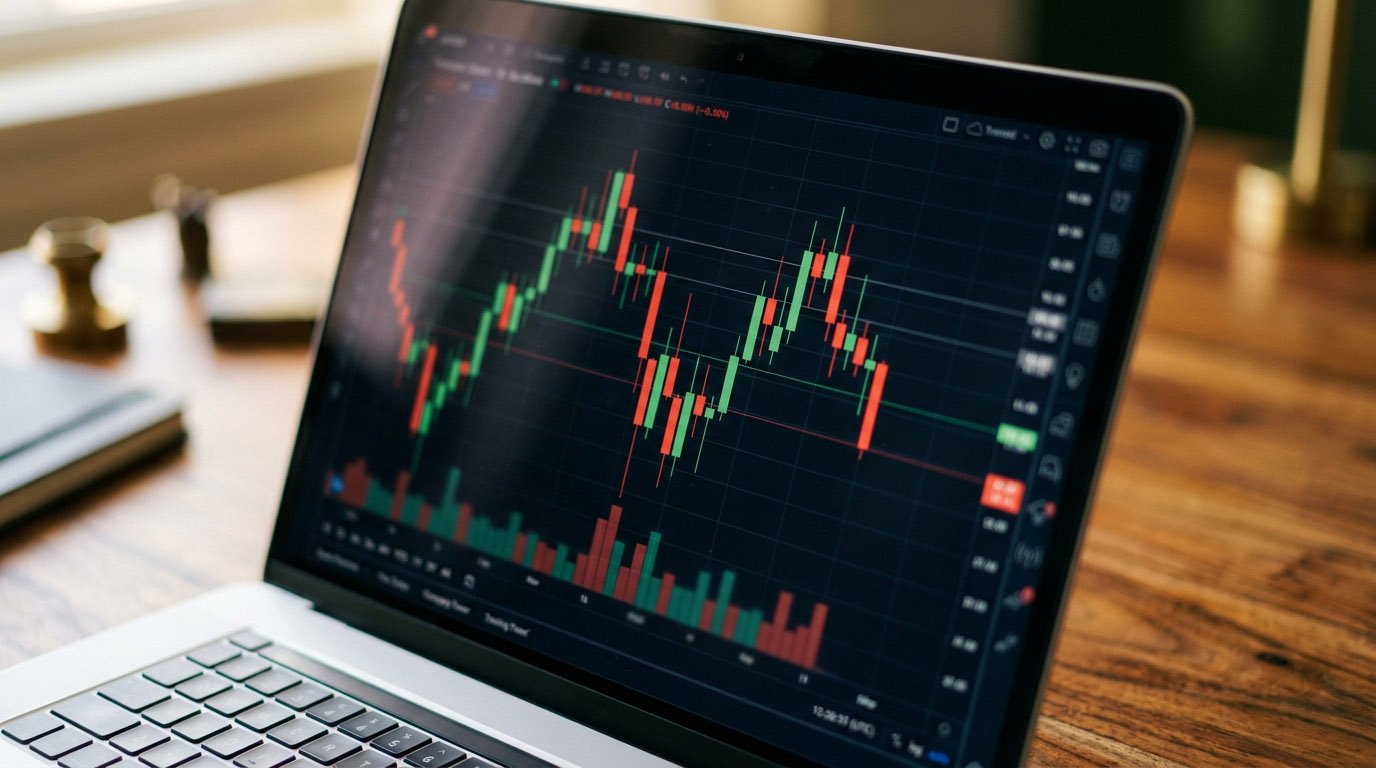
Stocks generate returns for investors in two ways. Price appreciation happens when a stock’s price rises above what you originally paid for it, letting you sell for a profit. Dividends happen when a company distributes a portion of its profits directly to shareholders, typically on a quarterly basis, without requiring you to sell anything.
Not every stock pays a dividend. Many younger or fast-growing companies reinvest all their profits back into the business instead, aiming to accelerate growth rather than pay out cash. Older, more established companies more commonly pay dividends, since they often have fewer high-growth opportunities left to reinvest that cash into.
Why diversification matters so much
Owning a single stock ties your fortunes entirely to one company’s performance. If that company struggles or fails, you can lose your entire investment in it. Diversification means spreading money across many different stocks, industries, or asset classes instead. That way, a single company’s poor performance doesn’t sink your entire portfolio.
Index funds offer instant, broad diversification, since a single purchase spreads your money across every company held within that index. That’s why broad index funds are commonly used as a foundational holding for long-term investors, rather than concentrating heavily in a small handful of individual stocks.
Bull markets, bear markets, and volatility
A “bull market” describes a sustained period of rising prices, generally accompanied by investor optimism. A “bear market” describes the opposite: a sustained decline, commonly defined as a drop of 20% or more from a recent high, generally accompanied by pessimism. Volatility simply measures how much and how quickly prices move, in either direction: a highly volatile stock swings sharply, while a low-volatility stock moves more gradually.
Markets have always cycled between bull and bear periods throughout history. Nobody can reliably predict exactly when a shift from one to the other will happen, though. This unpredictability is part of why a long time horizon and broad diversification matter so much for most individual investors, rather than trying to precisely time entries and exits around each cycle.
See how growth compounds over time
Understanding how the stock market works day to day is one thing; seeing what steady, long-term investing could actually produce is another. Our Investment Calculator projects how regular contributions, combined with an assumed average return, could grow over your own specific timeline.
Common questions about how the stock market works
Buying a stock means purchasing a small ownership stake in a publicly traded company through an exchange. You become a shareholder, with a claim on a proportional slice of the company’s assets and future profits. In most cases, you also get a small vote in major company decisions.
Prices move based on the constantly shifting balance between buyers and sellers. That balance itself responds to company news, broader economic data, interest rate changes, and shifts in overall investor sentiment.
A stock represents ownership in a single company. An index fund holds many stocks at once, tracking a specific index like the S&P 500, which spreads your investment across all the companies within that index in one purchase.
Investors make money two main ways. Price appreciation happens when a stock’s value rises above what you paid for it. Dividends happen when a company distributes part of its profits directly to shareholders, typically on a quarterly basis.
A few more things worth knowing
The S&P 500 is a stock market index tracking roughly 500 of the largest publicly traded U.S. companies, widely used as a benchmark for the overall performance of the U.S. stock market.
Yes, more so than a diversified fund. A single company’s stock ties your investment entirely to that one company’s performance, so if it struggles or fails, you can lose the full amount invested in it. Diversifying across many companies reduces this specific risk.