Bear Market vs Bull Market: What History Shows
A bear market vs bull market isn’t just a mood swing on a trading floor. Each one follows a specific definition. Each lasts a fairly predictable length of time. History shows a pattern most investors never expect: bull markets last far longer than bear markets do.

Bear Market vs Bull Market: The Actual Definitions
A bear market is a decline of 20% or more from a recent high. It has to be sustained over time, not just a single bad week. A bull market is the opposite. It’s a sustained rise of 20% or more from a recent low. Both terms describe a trend. Neither describes a single day’s move. A stock index can drop 20% in an afternoon crash without technically becoming a bear market, as long as it recovers quickly.
These thresholds are widely used conventions. They aren’t laws written into any regulation. Different analysts sometimes use slightly different cutoffs. But the 20% marker has become the standard reference point across most financial media and research.
Where the Names Actually Come From
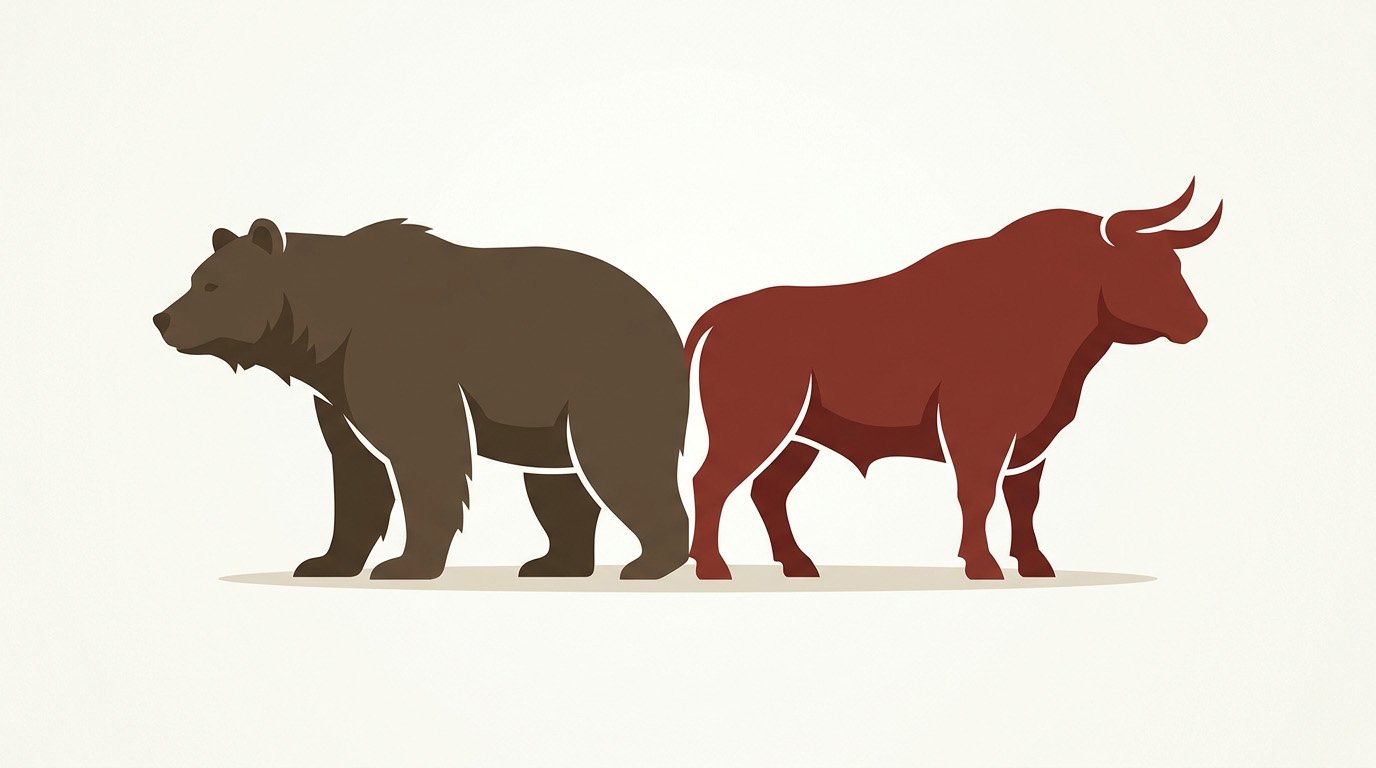
The animal metaphors go back further than most people assume. Some trace them to 18th-century London stock trading slang. A bear attacks by swiping downward with its paws. That mirrors a falling market. A bull attacks by thrusting upward with its horns. That mirrors a rising one. Nobody knows the origin story with total certainty. But the imagery stuck, since it’s easy to visualize under pressure.
How Long Each One Actually Lasts

This is where history surprises most people. Looking at U.S. stock market data going back to the 1940s, bull markets have historically lasted roughly four to five years on average. Some stretch much longer. Bear markets, by comparison, have historically lasted under a year on average, closer to nine or ten months.
The math behind this asymmetry matters more than it first appears. Markets spend the overwhelming majority of time rising, not falling. Bear markets happen, and they can feel brutal while they’re underway. But they represent a smaller fraction of total market history than the fear around them suggests.
How Deep Each One Typically Goes
Duration tells only half the story. Depth matters too. A typical bear market has historically produced average declines in the 30% to 35% range from peak to trough. Some run much deeper. The 2008 financial crisis saw a decline of more than 50%. The dot-com bear market that started in 2000 dragged on for roughly two and a half years.
Bull markets, meanwhile, have historically delivered average gains well over 100% from trough to peak. In some cases, far more. The bull market that ran through most of the 2010s produced cumulative gains stretching past 300% over its full run. This is the core reason staying invested through downturns tends to pay off over long time horizons. Recovery periods have historically dwarfed the losses that preceded them.
What Actually Triggers a Bear Market
Bear markets don’t have one single cause. Recessions trigger some, as corporate earnings fall and investors reprice stocks lower to match. Speculative bubbles trigger others. Prices climb far beyond what earnings could reasonably support, and a correction eventually forces them back down. External shocks, like a pandemic or a geopolitical crisis, can trigger a bear market almost overnight. Uncertainty spikes, and investors sell first and ask questions later.
Our article on what causes a stock market crash breaks down these triggers in more detail. A crash often marks the sharp opening chapter of what later gets classified as a full bear market.
What Actually Triggers a Bull Market
Bull markets tend to build more gradually than bear markets collapse. Falling interest rates often kick one off. Cheaper borrowing costs make it easier for companies to grow and for investors to justify higher stock valuations. Strong corporate earnings growth sustains a bull market once it’s underway. Investor confidence, once it returns after a downturn, tends to feed on itself. It pulls more capital back into stocks and pushes prices higher still.
Why Timing the Turn Is So Hard
Nobody rings a bell announcing a bear market vs bull market transition in real time. These labels only become official well after the fact, once enough time has passed to confirm the 20% threshold actually held. That delay creates a real trap for investors. By the time a bear market gets officially confirmed, a meaningful chunk of the decline has often already happened. By the time a bull market gets confirmed, a meaningful chunk of the recovery has often already happened too.
This is part of why trying to sell right before a crash rarely works out. Buying right before a recovery is just as hard to time. Missing even a handful of the market’s best days, which often cluster right after the worst ones, can meaningfully lower long-term returns compared to simply staying invested throughout.
What This Bear Market vs Bull Market History Means for Your Investing
If you’re investing for a long time horizon, like retirement decades away, both bear and bull markets are simply part of the ride. Given the historical asymmetry, time spent invested tends to matter more than timing the exact entry and exit points. Investing a fixed amount on a regular schedule, regardless of what the headlines say that week, is one practical way to avoid the trap of trying to guess the turn. Our guide on dollar-cost averaging explains why that steady approach tends to smooth out both the downturns and the recoveries over time.
If you want to see how a given return assumption plays out over your own timeline, our Investment Calculator lets you project growth using your own numbers. Our ROI Calculator can help you evaluate a specific past or projected return in isolation.
A Quick Historical Snapshot
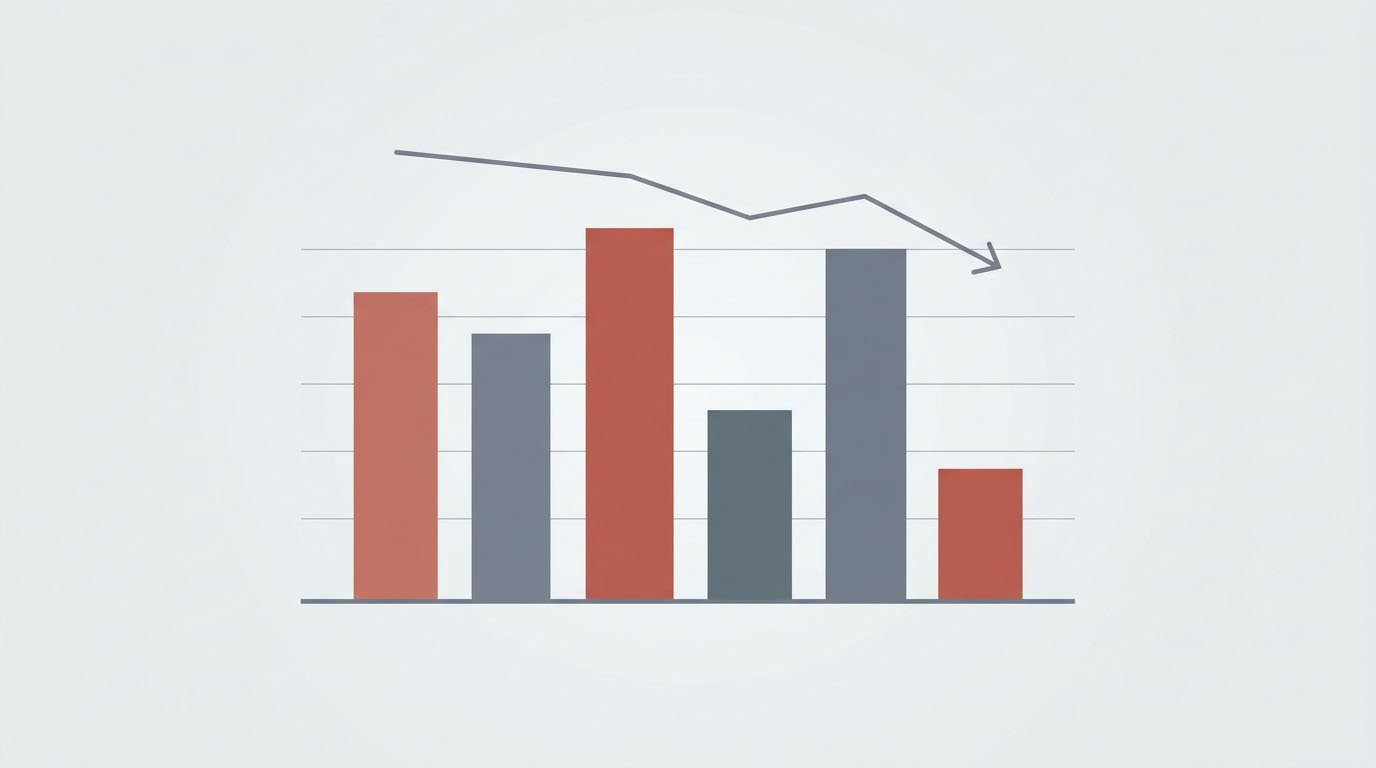
- 1973–74 bear market: Roughly 48% decline, driven by an oil crisis and high inflation.
- 2000–02 dot-com bear market: Roughly 49% decline, driven by a speculative tech bubble collapsing.
- 2007–09 financial crisis bear market: Roughly 57% decline, the deepest of the modern era.
- 2020 pandemic bear market: Roughly 34% decline, but the fastest recovery on record, lasting about a month.
Every bear market on this list eventually gave way to a bull market that more than recovered the loss. That pattern doesn’t guarantee the future will repeat exactly. But it’s the pattern history has shown consistently so far.
Common questions about bear market vs bull market
Most analysts confirm a bear market once a major index, like the S&P 500, has closed at least 20% below its most recent peak. There’s no single official body that declares it, so different sources sometimes confirm it on slightly different days.
No. Bear markets and recessions often happen together, but not always. Some bear markets occur without a matching recession, driven instead by speculative bubbles or external shocks rather than a broad economic downturn.
This depends on your personal timeline and risk tolerance, and it isn’t something a general article can answer for your specific situation. Historically, though, selling during a downturn locks in the loss and risks missing the recovery that has followed every past bear market.
A few more things worth knowing
No. A correction is typically defined as a decline of 10% to 20% from a recent high, smaller than a bear market. Corrections happen more frequently than bear markets and often resolve faster.
Historical counts vary slightly depending on the exact methodology used, but most tallies put the number at around a dozen or so significant bear markets in the U.S. since 1950, averaging roughly one every six to seven years.
Yes, in different markets or asset classes. Stocks might be in a bear market while bonds or a different country’s stock index is in a bull market. The terms apply to whatever specific index or asset is being measured.