What Is an Expense Ratio?
You never see this fee leave your account. No line item shows up on your statement. It still eats into your returns every single year, quietly, for as long as you hold the fund. Here’s what an expense ratio actually is. And here’s why a tiny-looking difference can cost thousands over a few decades.

A fee you never see withdrawn
An expense ratio is the annual fee a mutual fund or ETF charges to cover its operating costs. It’s expressed as a percentage of your investment. That percentage typically ranges from 0.03% to over 1%. Unlike most fees, you never see it come out of your account as a separate charge. The fund simply deducts it internally. Your quoted returns already reflect the fee, but the fee is still very real.
This invisibility is exactly why expense ratios go unnoticed by so many investors. There’s no bill to open. There’s no line item to question. The cost simply shows up as a slightly smaller return than the fund’s underlying investments actually produced.
How the fee actually gets deducted
Fund companies calculate the expense ratio as a percentage of assets under management. They deduct it gradually throughout the year, typically daily, directly from the fund’s assets. You don’t write a check or authorize a withdrawal. The fund’s net asset value simply reflects a slightly lower number than it would without the fee.
This is what makes expense ratios so easy to overlook. A fund charging a 1% expense ratio doesn’t send you a bill for 1% of your balance. It just delivers a return that’s roughly 1 percentage point lower than the fund’s gross performance. That gap repeats every single year, compounding against you the entire time you hold the fund. A fund you hold for 20 or 30 years accumulates that drag across every one of those years. This is why the fee matters far more than its small headline number suggests.
What counts as a good expense ratio

Broad market index funds often charge some of the lowest expense ratios available. Frequently that means under 0.10%, sometimes even under 0.03%. Actively managed mutual funds typically charge more, often between 0.5% and 1.5%. They employ analysts and portfolio managers who make active decisions rather than simply tracking an index. That staffing cost has to come from somewhere.
There’s no single number that applies to every fund type. What matters is comparing similar funds against each other. A 0.5% expense ratio might be reasonable for a specialized actively managed fund. That same 0.5% would be expensive for a plain S&P 500 index fund. A fund like that could be had for a fraction of that cost.
Index funds vs actively managed funds
Index funds track a specific market index, like the S&P 500. They simply hold the same securities in the same proportions. This passive approach requires far less staff and research, which is why index fund expense ratios run so much lower. Our Index Funds vs Mutual Funds article covers this distinction in more depth.
Actively managed funds employ a team trying to beat the market through stock selection and timing decisions. That extra effort costs money, and the fund passes that cost on through a higher expense ratio. Here’s the catch: most actively managed funds fail to beat their benchmark index over long periods. This holds true once fees are factored in. That makes the higher expense ratio a genuine gamble rather than a guaranteed advantage. Studies tracking fund performance over 10 and 15-year periods consistently find that most actively managed funds underperform their comparable index after costs.
The long-term cost of a small-looking difference
A gap between 0.1% and 1% sounds trivial on paper. Over decades, it compounds into a substantial amount. Invest $10,000 in a fund earning 7% annually before fees. A 0.1% expense ratio leaves you with roughly $74,000 after 30 years. The same investment in a fund charging a 1% expense ratio, earning that same underlying 7% return, leaves you with closer to $57,000. That’s a difference of roughly $17,000. It comes purely from a 0.9 percentage point gap in fees, on the exact same investment performance.
Our Investment Calculator lets you model this kind of comparison using your own numbers. That way you can see exactly how a lower-cost fund stacks up against a pricier alternative over your specific timeline.
Why the fee gets described as a “drag”
Financial writers often call an expense ratio a “drag” on returns. The metaphor fits. Picture the market pulling your investment forward at 7% a year. The expense ratio acts like friction, quietly slowing that forward motion by a fraction of a percentage point every single day. You don’t feel the drag on any given day. Over years and decades, the cumulative effect becomes impossible to ignore.
This is also why expense ratios matter more for money you plan to hold for a long time. A fee that costs you almost nothing over a single year can cost you tens of thousands of dollars over a 30-year retirement horizon, purely because compounding gives the fee more time to work against you. Short-term holdings feel the fee far less than long-term ones, which is part of why retirement accounts deserve extra scrutiny on this specific number.
Why fund companies still charge fees
Even index funds, which require minimal active management, still charge something. Someone has to maintain the fund’s technology, handle regulatory filings, and manage the mechanics of buying and selling securities as investors move money in and out. These costs are real, even for a fund that simply tracks an index without making active decisions.
What varies enormously between fund companies is how efficiently they run these operations, and how much profit margin they build into the fee. Large fund providers managing trillions of dollars can spread their fixed costs across an enormous asset base, which lets them charge a much smaller percentage than a smaller competitor running the same basic strategy. This scale advantage is part of why some of the largest index fund providers can charge fees close to zero while still running a profitable business.
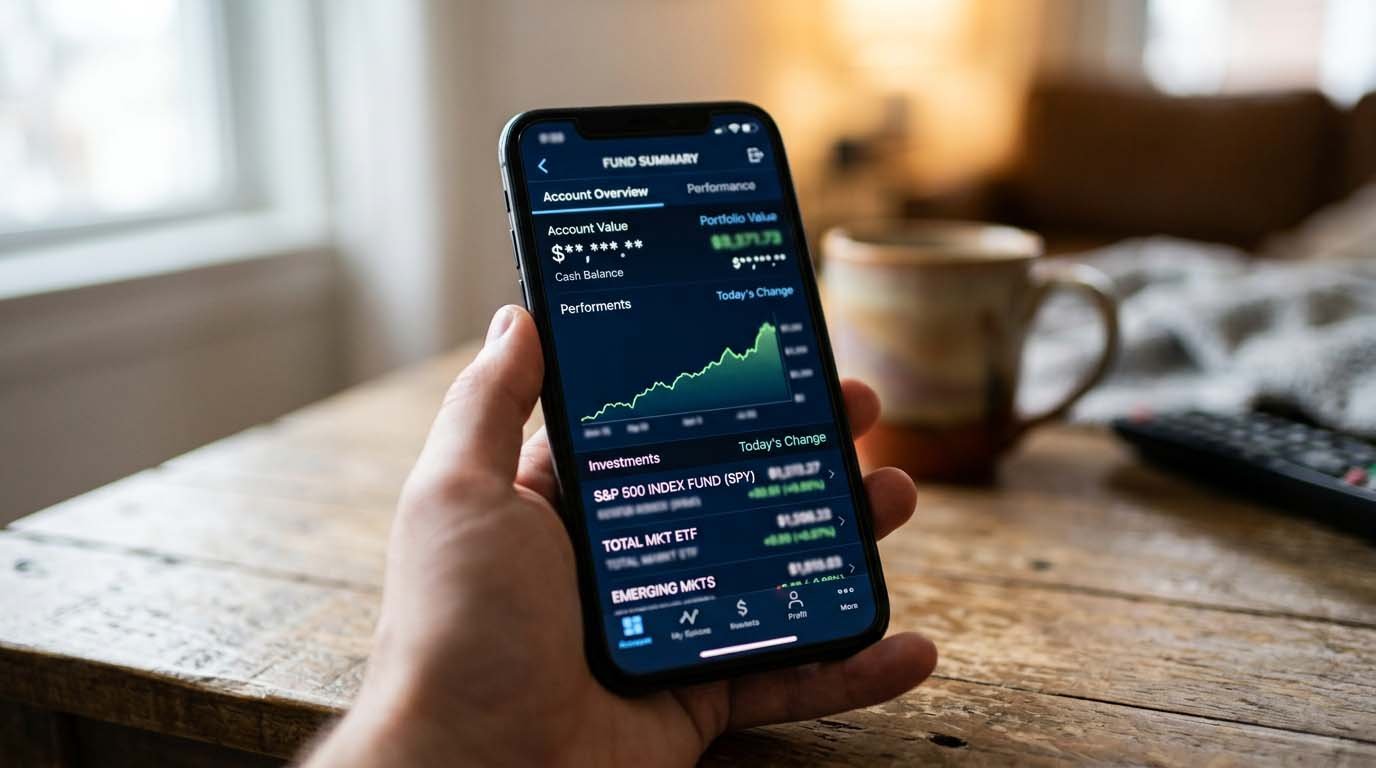
Every mutual fund and ETF publishes its expense ratio in its prospectus. Most brokerage platforms display it directly on the fund’s summary page. Look for the term “expense ratio.” Sometimes you’ll see “gross expense ratio” alongside “net expense ratio” instead. Some funds temporarily waive part of their fee, which shows up as a difference between the two figures.
If a brokerage doesn’t make this number obvious, search the fund’s ticker symbol alongside “expense ratio.” That usually surfaces it within seconds. It’s worth checking before investing in any fund, not just comparing headline returns.
Expense ratio isn’t the only cost
While expense ratio is the most visible ongoing cost, it isn’t the only one. Some mutual funds charge a sales load, a commission paid when you buy or sell shares. This is separate from the expense ratio entirely. Trading costs and bid-ask spreads can also add a small hidden cost to ETFs, particularly less liquid ones. Our ETF vs Stock article touches on some of these additional cost factors.
None of these additional costs are usually as significant as the expense ratio itself. But it’s worth being aware that the expense ratio alone doesn’t capture every dollar a fund might cost you. A fund advertising a low expense ratio but charging a sales load can still end up more expensive overall. That’s true even against a slightly higher-cost fund with no load at all.
A side-by-side example
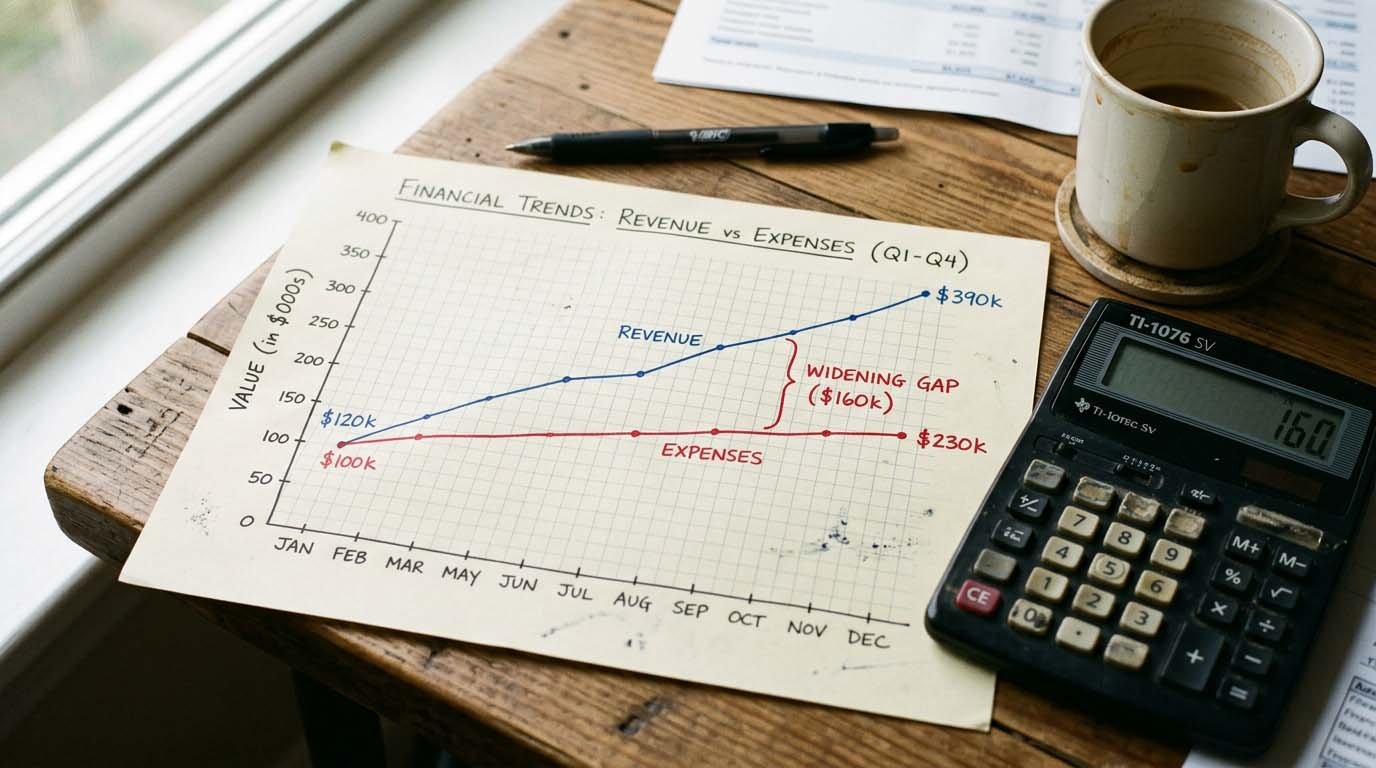
Say two investors each put $500 a month into retirement accounts for 30 years. Both earn the same 7% gross annual return. The first chooses a fund with a 0.05% expense ratio. The second picks a similar fund charging 0.75% instead. By the end of the 30 years, the first investor ends up with roughly $588,000. The second lands closer to $517,000. Same contributions, same underlying market performance, but a gap of over $70,000, purely from the difference in fees.
This example uses identical gross returns to isolate the fee’s impact. In practice, an actively managed fund charging 0.75% might occasionally outperform its benchmark before fees. But the odds of that outperformance persisting, and exceeding the fee gap, over three full decades are historically low. Betting on that outcome means accepting real risk in exchange for the mere possibility of beating a strategy that costs almost nothing to execute.
Check your own portfolio
Pull up the funds in your 401(k), IRA, or brokerage account and check each one’s expense ratio. Many people go years without ever looking, simply because the fee never shows up as a visible transaction. Our 401(k) vs IRA and Roth vs Traditional IRA articles can help if you’re also weighing account type alongside fund selection. Want to model exactly how a fee difference compounds over your own investment horizon? Our Investment Calculator gives you the real numbers rather than a generic estimate.
Checking this one number, once, takes a couple of minutes. Switching from a high-cost fund to a comparable low-cost alternative can be one of the simplest ways to improve a portfolio’s long-term outcome. It doesn’t require predicting the market at all, just picking the cheaper of two similar options.
Common questions about expense ratios
No. The fund deducts it internally from the fund’s assets, typically daily. You never write a check or see a separate withdrawal. It simply results in a slightly lower return than the fund’s underlying investments produced.
Occasionally, for specialized strategies that are difficult to replicate with a low-cost index fund. But for broad market exposure, most actively managed funds fail to justify their higher fee over long periods once performance is measured after costs.
Many broad market index funds charge under 0.10%, and some charge under 0.03%. Paying significantly more than that for a fund tracking a common index, like the S&P 500, is usually unnecessary.
A few more things worth knowing
Not automatically. Expense ratio is one factor, not the only one. A fund’s holdings, strategy, and how well it fits your goals also matter. But between two similar funds tracking the same index, the one with the lower fee is almost always the better choice.
Check the fund’s prospectus or its summary page on your brokerage platform. Most platforms display the expense ratio directly next to the fund’s ticker symbol and performance history.
The expense ratio itself belongs to the fund, not the account type, but 401(k) plans sometimes offer a more limited fund lineup, occasionally with higher-cost options than you’d find in a self-directed IRA. It’s worth checking both if you have the choice.