What Is CAGR and How Does It Work?
CAGR shows up on mutual fund fact sheets, startup pitch decks, and real estate listings, usually printed in bold like it’s supposed to settle the argument on its own. It measures something real: the steady annual rate that would have produced the same result as a genuinely messy, up-and-down few years. Here’s what it actually calculates, and what it quietly leaves out.
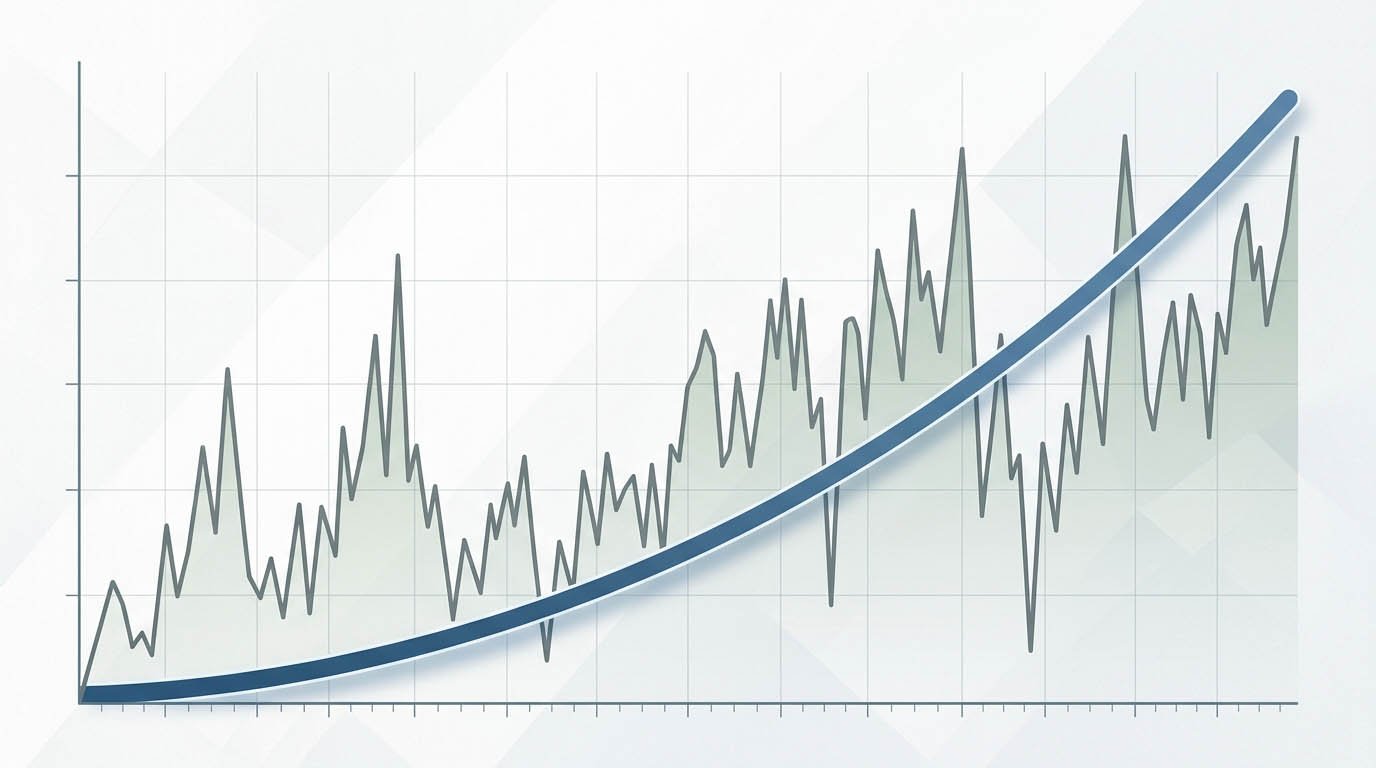
CAGR isn’t the same thing as average return
CAGR stands for compound annual growth rate. It’s the constant yearly rate that would carry an investment from its starting value to its ending value, assuming every bit of growth stays invested and keeps compounding along the way. That’s a mouthful, so here’s the short version: it’s the single number that answers “how much did this grow, per year, on average, once you account for the fact that gains build on gains?”
People often reach for a simpler shortcut instead: add up each year’s return and divide by the number of years. That’s an arithmetic average, and it feels intuitive, but it quietly ignores compounding. A portfolio that gains 50% one year and loses 50% the next has an arithmetic average return of 0%. Its actual value dropped by a quarter. CAGR catches that. A plain average doesn’t.
The formula, and it’s less painful than it looks
CAGR = (Ending Value ÷ Beginning Value)^(1 ÷ Number of Years) − 1
Take an account that starts at $10,000 and grows to $15,000 over five years. Divide the ending value by the starting value and you get 1.50, meaning the account is worth one and a half times what it started at. Raise that to the power of one-fifth (since there were five years) and you get roughly 1.0845. Subtract 1, and you’re left with 0.0845, or 8.45%. That’s the CAGR: a 5-year, 50% total gain translates to about 8.45% growth per year, compounded.
Notice that 8.45% times 5 doesn’t equal 50%. It’s less than that, on purpose. Compounding means each year’s growth is calculated on a bigger base than the year before, so the annual rate needed to hit a given total is always a bit lower than simple division would suggest. If you just want a rough mental shortcut for how long it takes money to double at a given rate, our Rule of 72 guide covers that quick estimate. For the full year-by-year math, our Compound Interest Calculator handles a lump sum or regular contributions at any compounding frequency.
Why it smooths out the wild swings
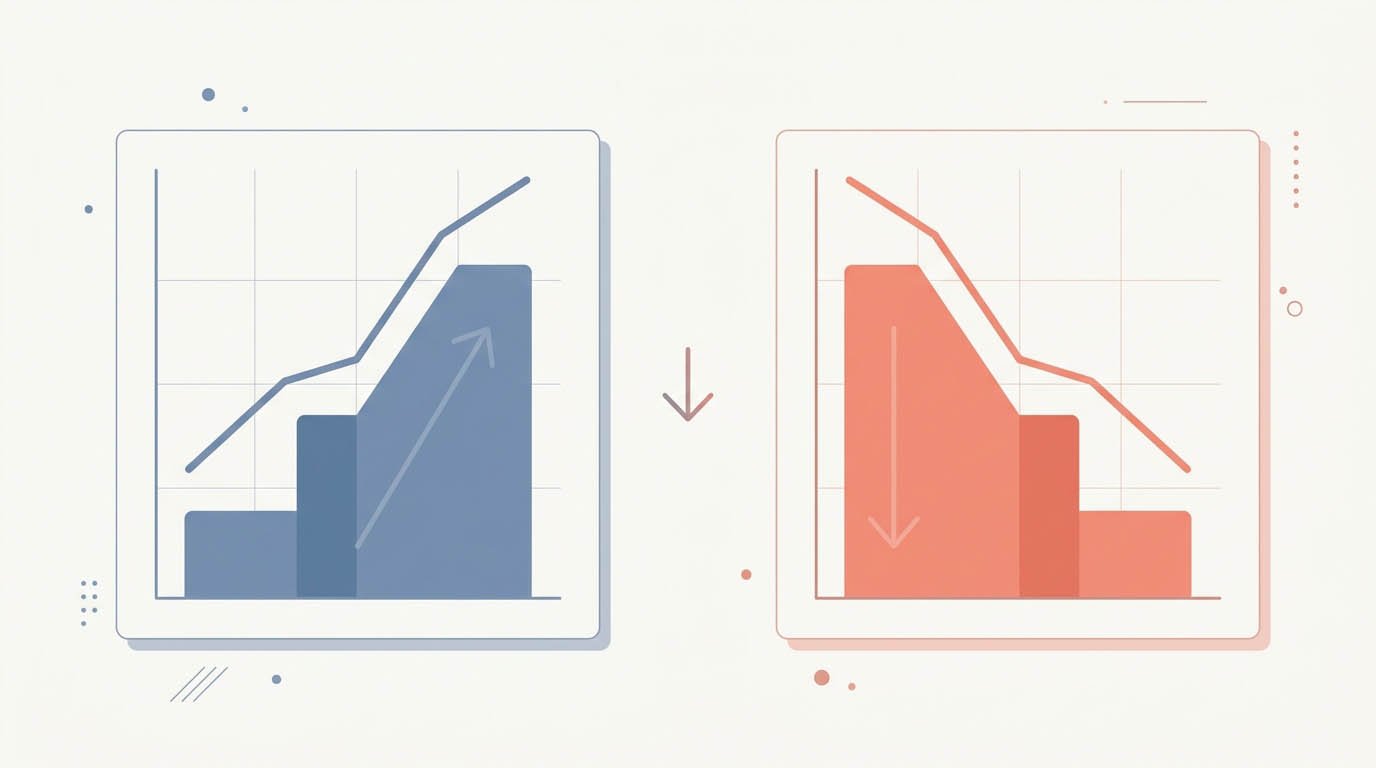
Real investments almost never move in a straight line. A stock might climb 30% one year and drop 20% the next. Reporting each year’s return separately is accurate but hard to compare against a different investment with a different pattern of swings. CAGR converts that entire messy path into one clean number, as if the growth had happened evenly, year after year, the whole way through.
Run the earlier example again, but with real volatility this time: a $10,000 account that gains 50% in year one, then loses 50% in year two. After year one it’s worth $15,000. After year two it’s worth $7,500. The arithmetic average of +50% and −50% is 0%, which makes it sound like nothing happened. CAGR tells the truth: (7,500 ÷ 10,000)^(1/2) − 1 works out to about −13.4% per year. The account actually shrank, and CAGR is the number that shows it.
This is the core reason analysts, fund managers, and anyone comparing two investments lean on CAGR instead of a simple average. It’s a geometric measure, not an arithmetic one, and geometric measures are what compounding actually behaves like. If the distinction between growth that’s simply added up and growth that compounds is still a bit fuzzy, our Simple vs Compound Interest guide walks through it with its own set of examples.
Where CAGR actually gets used
Investors use it to compare funds, stocks, or portfolios that were held for different lengths of time, including comparisons like the one in our Index Funds vs Mutual Funds guide, where fee drag and CAGR over long stretches matter more than any single year’s return. A fund that returned 60% over three years and one that returned 100% over six years look impossible to compare at a glance. Convert both to CAGR (about 17% and 12.2% per year, respectively) and the shorter fund actually grew faster on an annual basis, even though its total return looks smaller on paper.
Businesses use the same math for revenue, user counts, or subscriber growth, especially in pitch decks and annual reports, since it’s the standard way to describe multi-year growth without cherry-picking a single strong quarter. Real estate investors apply it to home or property values across a holding period. Retirement planners use it as a long-run assumption for what a portfolio might return per year over decades, since single-year swings matter less than the compounded path, and our Retirement Calculator lets you plug in an assumed CAGR to see where that leaves your balance decades out.
What CAGR doesn’t tell you
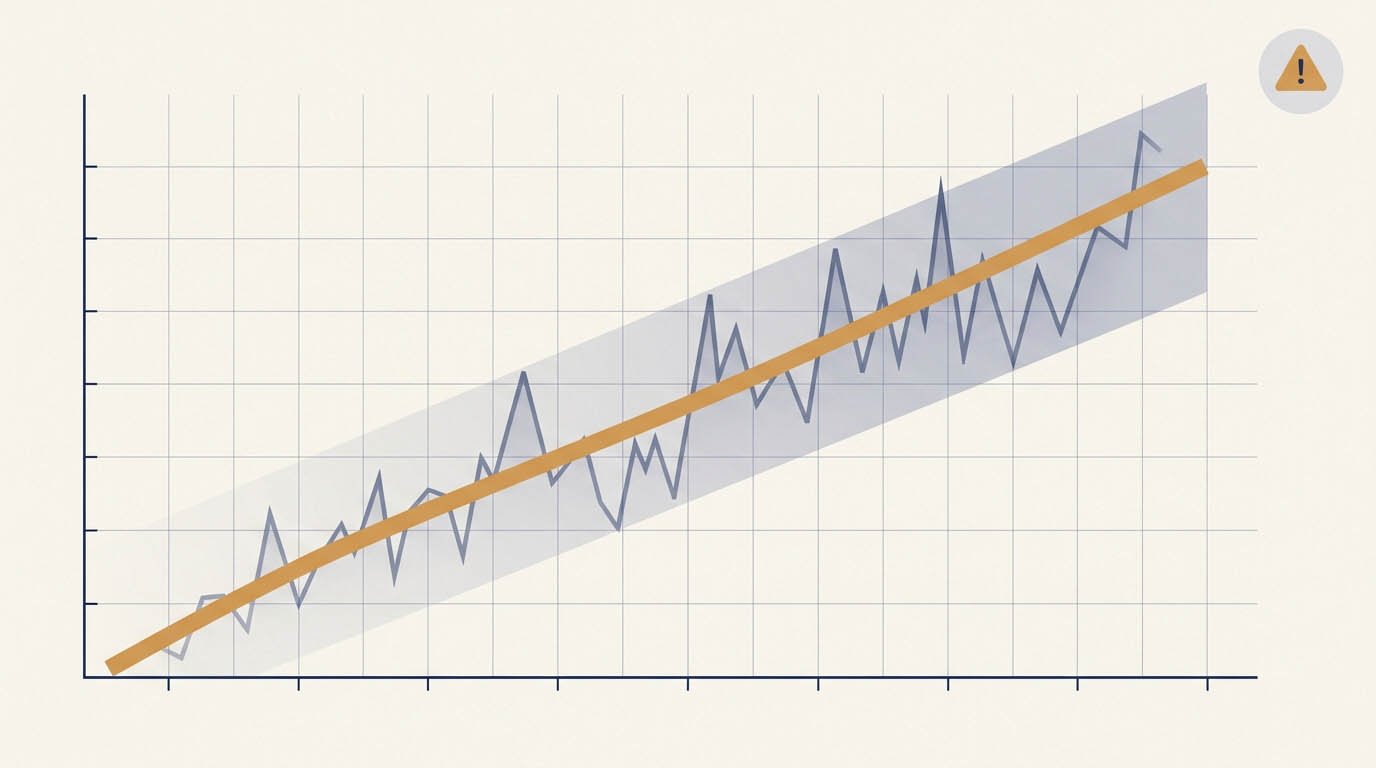
CAGR is a summary, and summaries leave things out. The biggest one: it says nothing about how bumpy the ride was. Two investments can post the exact same CAGR over ten years while one moved up gently and the other lurched through a 40% crash along the way. If you can’t stomach volatility, the CAGR alone won’t warn you it’s coming.
It also assumes a single lump sum sitting untouched from start to finish. Add regular contributions, like a 401(k) or a monthly brokerage deposit, and a plain CAGR calculated on beginning and ending balance stops being meaningful, since some of that “growth” is just new money you put in, not investment return. There are variations built for that case (money-weighted or dollar-weighted return), but the basic CAGR formula isn’t one of them.
And, like every backward-looking metric, a strong historical CAGR is a description of the past, not a promise about the future. A five-year run of 20% annual growth doesn’t mean the next five years will look anything like it.
A quick example: total return can trick you
Say you’re choosing between two past investments to judge a manager’s track record. Investment A turned $10,000 into $20,000 over five years, a 100% total gain. Investment B turned $10,000 into $18,000 over three years, an 80% total gain. On raw totals, A looks like the better performer.
Run the CAGR instead. Investment A: (20,000 ÷ 10,000)^(1/5) − 1 ≈ 14.87% per year. Investment B: (18,000 ÷ 10,000)^(1/3) − 1 ≈ 21.65% per year. B actually grew faster on an annualized basis, it just had less time to compound. Comparing total return alone would have led you to the wrong conclusion. This is exactly the kind of mismatch CAGR exists to catch, and it’s also why a plain ROI Calculator, which reports that raw 100% or 80% figure, isn’t the right tool when you’re judging performance across different time frames.
Run your own numbers
If you want to compare two of your own investments, or check what growth rate a fund’s marketing materials are actually implying, our CAGR Calculator does the math instantly: plug in a beginning value, an ending value, and the number of years, and it returns the annualized rate behind those numbers. It won’t tell you whether that rate is good or bad for your goals, that depends on what you’re comparing it against, but it will get you to the one number that’s actually safe to compare across different holding periods. Going the other direction, our Investment Calculator takes a CAGR you assume and projects what it would turn a lump sum or ongoing contributions into by a future date.
Common questions about CAGR
Generally yes, a higher CAGR means faster annualized growth over the period measured. But it doesn’t capture risk. An investment with a high CAGR achieved through wild swings isn’t automatically a better choice than one with a slightly lower, steadier CAGR, especially if you can’t afford to ride out a sharp drop along the way.
Average annual return (an arithmetic mean) simply adds up each year’s percentage return and divides by the number of years. CAGR (a geometric mean) accounts for compounding by looking only at the starting and ending values. When returns vary year to year, the arithmetic average is always higher than the CAGR, sometimes by a lot.
Only if you build them into the ending value. If you’re calculating a stock’s CAGR using just its share price, you’re leaving out any dividends paid along the way. For an accurate picture of total investment growth, use an ending value that includes reinvested dividends, not just the price change.
A few more things worth knowing
Yes. If the ending value is lower than the beginning value, the CAGR comes out negative, reflecting an annualized loss rather than a gain. It works the same way in both directions.
There’s no fixed answer, since it depends heavily on the time period and asset mix. Broad U.S. stock indexes have historically returned somewhere in the high single digits to low double digits annually over long stretches, though any given period can land well above or below that. Compare a fund’s CAGR to a relevant benchmark over the same years rather than to a single “good” number, and keep in mind that how spread out your holdings are, covered in our What Is Diversification? guide, affects how much of that CAGR you’ll actually experience without a gut-check year along the way.
Not cleanly. A plain CAGR calculated on beginning and ending balance will overstate growth if you’ve been adding contributions along the way, since some of that increase is new money, not investment return. For accounts with regular deposits, a money-weighted or dollar-weighted return gives a more accurate picture. This is exactly the situation covered in our Dollar-Cost Averaging vs Lump Sum guide, where new contributions arriving over time complicate any simple before-and-after growth calculation.