What Is CPI (Consumer Price Index) and How It’s Measured
The consumer price index is the number behind almost every inflation headline you read. Social Security raises, Federal Reserve policy, even your paycheck negotiations all trace back to this figure, even though most people have never seen how it’s actually calculated.

The Consumer Price Index, in Plain Terms
The consumer price index tracks how much a fixed set of everyday goods and services costs over time. Groceries, rent, gas, healthcare, clothing. Add them all into one basket. Track that basket’s total cost month after month. You get a single number that moves as prices rise or fall across the economy.
This is the most widely cited measure of inflation in the United States. A news headline says inflation hit a certain percentage? It’s almost always referring to a change in this specific index, comparing the current month or year against a previous one.
How the Government Actually Calculates This Number

The Bureau of Labor Statistics collects prices on thousands of specific items every month. This happens at actual stores and service providers across the country. These items get grouped into categories: food, housing, transportation, medical care, recreation, and several others.
Each category gets a specific weight, based on how much the average household actually spends on it. Housing carries the heaviest weight by far. It represents the largest chunk of a typical budget. A small move in housing costs shifts the overall index far more than the same percentage move in something like recreation, which carries a much smaller weight.
How Far Back This Index Actually Goes
The Bureau of Labor Statistics has tracked a version of this index since the early 20th century, originally created to help set wages during World War I. The methodology has changed substantially since then, with periodic updates to the basket, the weighting formula, and how quality adjustments get calculated.
This long history matters for a practical reason. Economists and journalists routinely compare prices across decades using this index, adjusting old dollar figures into today’s terms. A car that cost $3,000 in 1970 can be translated into a rough equivalent modern price, purely by using the change in this index between those two points in time.
CPI vs. Inflation: How They Actually Relate
Inflation is the concept. This index is one specific way to measure it. Say “inflation is 3%,” and you usually mean this index rose 3% compared to the same period a year earlier. It’s a measurement tool, not inflation itself, though the two terms get used almost interchangeably in everyday conversation.
Our article on what is inflation and why does it matter covers the broader economic concept in more depth. It explains what actually drives rising prices in the first place. This article focuses specifically on how that concept gets turned into a trackable number.
There’s More Than One Version of This Index
The most commonly cited version covers urban consumers. It represents roughly 93% of the U.S. population. A separate version tracks urban wage earners and clerical workers specifically. That’s a narrower group used for certain benefit calculations, like some union contracts and Social Security cost-of-living adjustments.
A third version, often called core CPI, strips out food and energy prices entirely. These two categories swing wildly month to month due to weather, geopolitical events, and seasonal factors that don’t reflect the broader economy’s underlying trend. Removing them gives a steadier read on where prices are actually heading over time, away from short-term noise.
Why Core CPI Gets So Much Attention
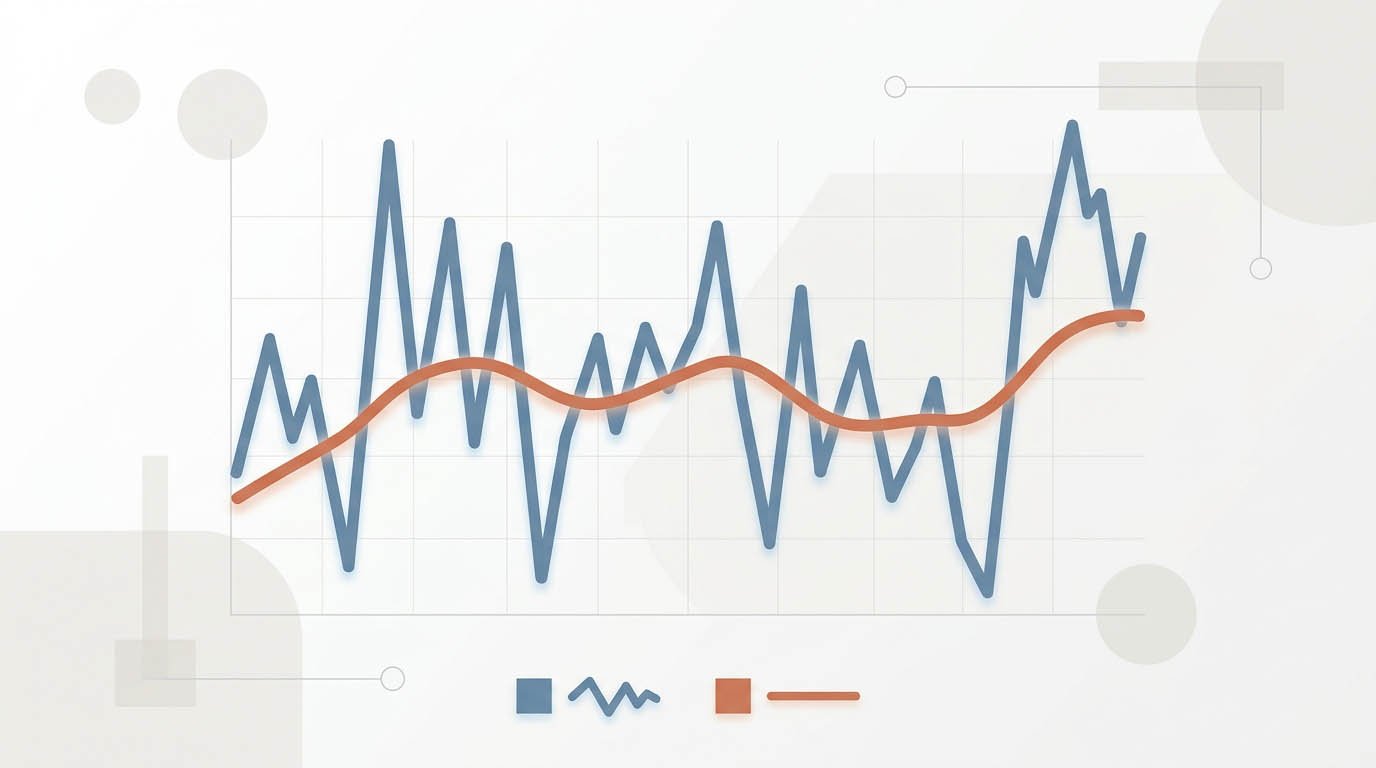
Economists and policymakers often pay more attention to core CPI than to the headline number. Food and energy prices bounce around so much that they can distort the bigger picture. A spike in gas prices from a single geopolitical event can push the headline number up sharply for a month or two, without reflecting any real change in underlying economic conditions.
The Federal Reserve watches core CPI closely, alongside a related measure called core PCE. This happens when deciding whether to raise, lower, or hold interest rates steady. A persistently high core reading signals broad-based price pressure that monetary policy might need to address, rather than a temporary spike that will likely reverse on its own.
How This Number Directly Affects Your Life

Social Security benefits adjust annually based on changes to this index. This happens through what’s called a cost-of-living adjustment. A higher reading generally means a bigger increase in benefit checks the following year. It’s intended to help recipients keep pace with rising costs.
Many union contracts, some rental leases, and certain government benefit programs also tie their annual adjustments directly to this same index. Even wage negotiations outside formal contracts often reference recent inflation data as a benchmark. What counts as a “fair” raise depends heavily on how much prices have risen since the last adjustment.
A Concrete Example of How the Math Works
Say a representative basket of goods and services cost $1,000 in a given base period. One year later, that exact same basket costs $1,032. Divide the new cost by the old cost. Subtract one. Multiply by 100. The result is 3.2%, the annual inflation rate as measured by this index over that one-year period.
This calculation happens every single month. It compares the current basket cost against the same month a year prior. That’s why you’ll often see both a monthly figure and a year-over-year figure reported together in economic data releases.
Where This Measure Falls Short
The fixed basket doesn’t perfectly match any individual household’s actual spending. A retiree spending heavily on healthcare experiences inflation differently than a young renter spending heavily on housing and transportation. Both still live under the same overall index reading, even though their real experience differs.
There’s also something called substitution bias. Beef prices spike, and consumers often shift toward chicken instead. A fixed basket doesn’t always capture that behavior change quickly. The Bureau of Labor Statistics has methods to partially adjust for this over time. The basket composition still lags real-world shifts in consumer behavior to some degree, though.
How This Connects to Interest Rate Decisions
The Federal Reserve uses inflation data, including this index, as one of its primary inputs when setting interest rate policy. Our article on how interest rates affect the economy explains this connection in more detail. It covers why a high inflation reading often leads to higher interest rates, which in turn affects everything from mortgage rates to credit card APRs.
Understanding this chain, from a monthly price survey all the way to your own mortgage rate, helps explain why a single economic data release can move markets and shape headlines the way it does each month.
Running Your Own Numbers
If you want to see how inflation has actually affected the purchasing power of a specific dollar amount over time, our Inflation Calculator can show you exactly how much prices have shifted using this same underlying data.
Common questions about the consumer price index
Monthly. The Bureau of Labor Statistics typically releases the new figure in the second week of the following month, covering price data collected throughout the prior month.
They’re related but not identical. CPI measures price changes for a fixed basket of goods and services, while true cost of living also factors in changes in what people actually buy and how their needs shift over time.
Housing represents the single largest expense category for the average household, so it’s weighted heavily to reflect how much it actually matters in a typical budget compared to smaller categories like recreation or apparel.
A few more things worth knowing
The Bureau of Labor Statistics does make quality adjustments for certain goods, like electronics that improve significantly year over year, attempting to isolate pure price change from quality change, though this process is imperfect and debated among economists.
Neither is universally more important, they serve different purposes. Headline CPI reflects what consumers actually pay overall, while core CPI helps policymakers spot underlying trends without noise from volatile food and energy prices.
No. Most countries publish their own version, but the specific basket, weighting methodology, and release schedule vary, making direct international comparisons more complicated than they first appear.